If you’ve had a look around 67 Bricks website, you probably know that we work with quite a few clients. For most of the clients we host their infrastructure, which makes it easier for us to manage it and troubleshoot any issues when they occur. Each client’s infrastructure resides in its own AWS account, which is a part of AWS Organizations. We also have a logging AWS account which is used for infrastructure resources used by client accounts. In this shared account we have set up an ELK stack to collect logs from multiple clients in one place. In this post I will explain how it is set up.
What is ELK?
ELK stands for ElasticSearch, Logstash and Kibana.
A note: in this post I’m going to mention Amazon OpenSearch Service. In the past was called Amazon ElasticSearch Service. Amazon OpenSearch Service uses a fork of older version of ElasticSearch and Kibana. The name ELK, however, seems to have stuck even if OpenSearch is used instead of ElasticSearch (and ELK sounds nicer than OLK, in my opinion).
What is the infrastructure like?
The main elements are AWS Managed OpenSearch instance and an EC2 reverse proxy, which directs requests to OpenSearch. In terms of networking we have VPC peering connections between the VPC of the logging account, where OpenSearch instance resides, and the client account VPCs.
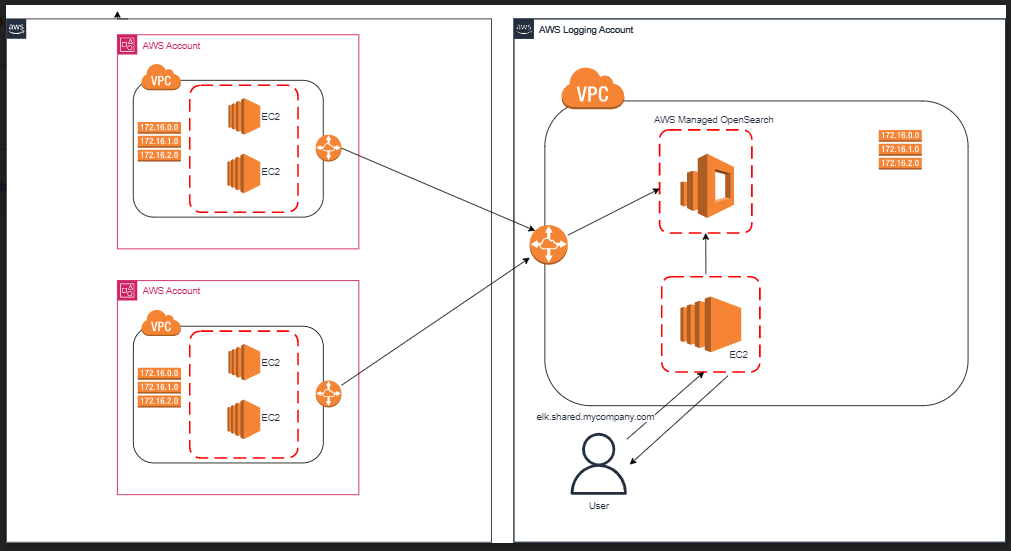
To clarify the above diagram:
Applications send log entries via peering connections. In order for them to be able to do that, the following is required:
1) The security group attached to the servers or containers running the applications must have a rule that allows traffic on port 443 from the CIDR block of the logging account VPC
2) The route table of the VPC in the client accounts must have a route with the logging account VPC CIDR as destination and peering connection as target
3) The security group attached to the OpenSearch instance must allow traffic on port 443 from CIDR ranges of client account VPCs
4) The route table of the VPC in the logging account must have routes with the client account VPC CIDRs are destination and peering connection as target
How do the applications send logs to the ELK instance?
Most applications that send logs are Scala Play applications – they use Logback framework for logging, and the logback.xml file with configuration. We have an appender section for ELK logs – we add it to all applications that send their logs to ELK, thereby ensuring that log entries are the same regardless of the system and have the same fields:
 <appender name="ELK" class="com.internetitem.logback.elasticsearch.ElasticsearchAppender">
    <url>${elkEndpoint}/_bulk</url>
    <!-- This nested %replace expression takes the first letter of the level and maps D and T
    (for DEBUG and TRACE) to d and maps other levels to i -->
    <index>someClient-${environment}-someApp-logs-%replace(%replace(%.-1level){'[DT]', 'd'}){'[A-Z]', 'i'}-%date{yyyy-MM-dd}</index>
    <type>log</type>
    <loggerName>es-logger</loggerName>
    <errorsToStderr>false</errorsToStderr>
    <includeMdc>true</includeMdc>
    <maxMessageSize>4096</maxMessageSize>
    <properties>
      <property>
        <name>client</name>
        <value>iclr</value>
      </property>
      <property>
        <name>service</name>
        <value>ingestion</value>
      </property>
      <property>
        <name>host</name>
        <value>${HOSTNAME}</value>
        <allowEmpty>false</allowEmpty>
      </property>
      <property>
        <name>severity</name>
        <value>%level</value>
      </property>
      ...
  </appender>
Here, environment, elkEndpoint and HOSTNAME are environment variables. environment and elkEndpoint are injected in the EC2 launch template and are populated when the instances are being started.
YOu can also see the <index> element. This will create a new index every day. Before we start sending application logs to ELK, we create an index pattern for each application. An index pattern allows you to select data and can include one or more indices. For example, if we have an index pattern someClient-live-someApp-logs-d-*, it would include indices someClient-live-someApp-logs-d-2023-02-27 , someClient-live-someApp-logs-d-2023-03-13, someClient-live-someApp-logs-d-2023-03-14 and so on.
How do you know if there is a problem with logs?
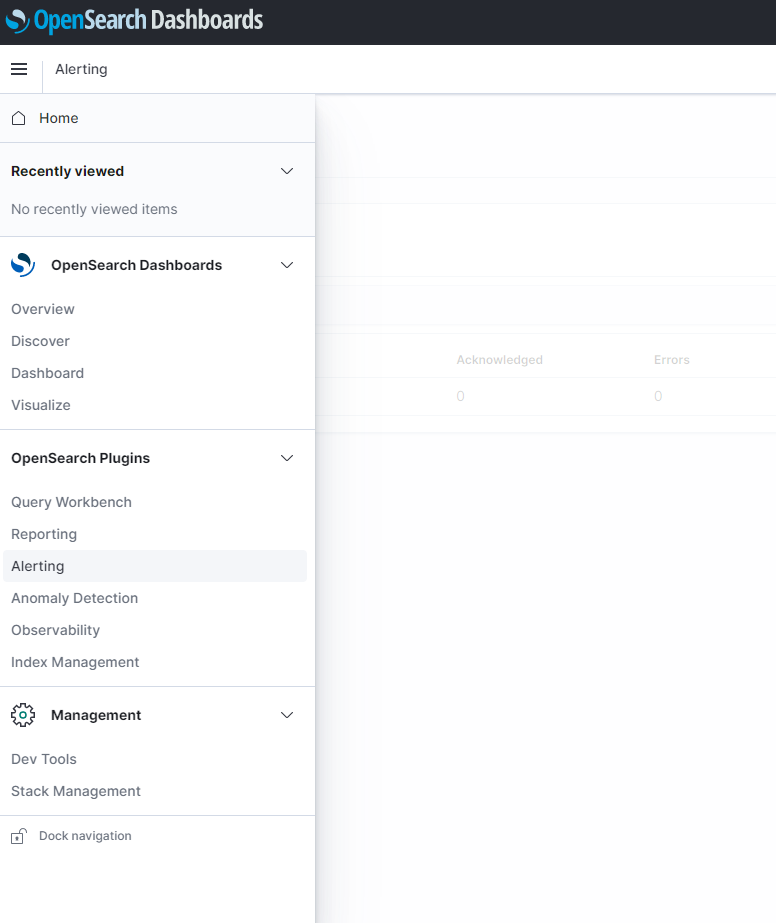
We have monitors set up in Kibana which check that there are logs coming in. This check is run every 10 minutes on each index pattern, and if it doesn’t find any log entries, it sends an alert to an SNS topic which in turn sends an email to inform us that there is a problem. The configuration of alarms and monitors can be done from the OpenSearch Plugins menu of Kibana.
At the moment these monitors are created manually for each index pattern, which is not ideal because it does take a bit of time setting them up; therefore one of the tasks on our to-do list is to automate monitor creation.
How do you make sure that the OpenSearch instance always has enough space?
When each new index pattern is created, we apply a lifecycle policy to it. For example, we delete info logs after a week; when the index agent is 7 days old, it starts to transition into the Delete state. We also have a Cloudwatch alarm which monitors FreeStorageSpace metric in the AWS/ES namespace.
How do YOU centralize logs from multiple systems on AWS? 🙂